Using Predicto - A beginner's guide
updated, Mar 13th 2021
When first signing up for Predicto, you might be overwhelmed with all the information you are suddenly exposed to. This is normal. You don't have to be a Deep Learning expert to use Predicto but it is important to know its building blocks. Going through this guide will help you understand how to use our platform the right way from Day One!
Before we start
It is important to know that everything you see in Predicto is auto-generated by Deep Learning models and algorithms. There is no human intervention besides the initial training and occasional re-training of our models. We offer a platform where you, the investor/trader, can explore our forecasts and decide which models to trust and when. We provide you with several tools to perform this exploration. As a reminder, please make sure you've read and understood our Disclaimer.
As we go through this tutorial, we'll provide links to relevant Predicto sections where you can explore real life examples.
Introduction
Predicto is a fully autonomous stock & crypto forecasting AI pipeline. You can think of it as a machine running
24 hours per day, mining and consuming various streams of data (in our case financial, options and news data),
generating stock forecasts and trades (we call those generated trades Trade Picks).
At the same time it produces graphs and insights that users
can explore to better understand the internals and the inner logic of this machine. Finally, by analyzing
our daily forecasts we are able to compile some overall market signals that we call Outlook Signals
and can give us some hints about the short-term horizon of the stock market.
You now have access to this pipeline and you can explore it daily to extract insights.
Our platform can be used in two different ways:
- Manually explore our daily Forecasts, Trade Picks and Outlook Signals.
- Consume Predicto's intelligence via Predicto API to support your own automated Trading algorithms.
In this guide, we will focus on the manual part. If you are interested in the API part of Predicto, there is already another guide covering the basics here.
We'll focus on how to read and interpret Predicto's auto-generated insights and understanding why and how those are generated. When you are done reading this article, you'll have a good idea on how to make more informed decisions by:
- Studying Outlook Signals
- Studying Trade Picks
- Studying Forecasts
- Studying recent Forecast Performance
How to study Outlook Signals
Outlook Signals are the end product of our AI pipeline. They are generated a few hours after market closes daily and they are available daily in the Outlook section. We currently have 3 types of signals but the list might grow in the future. Let's go through them one by one.
-
Nasdaq Outlook Score: By combining forecasts and trades generated by our PredictoAI from all models related to Nasdaq-100 list, we are able to compile a forecast score which indicates the stock market feeling with a 3-weeks ahead horizon. In short, it shows the predicted movement in 3 weeks. We interpret sudden changes in this score as a signal to investigate deeper and understand why. Fore more details, there is a detailed blog post about this signal ( Introducing Predicto Market Outlook ).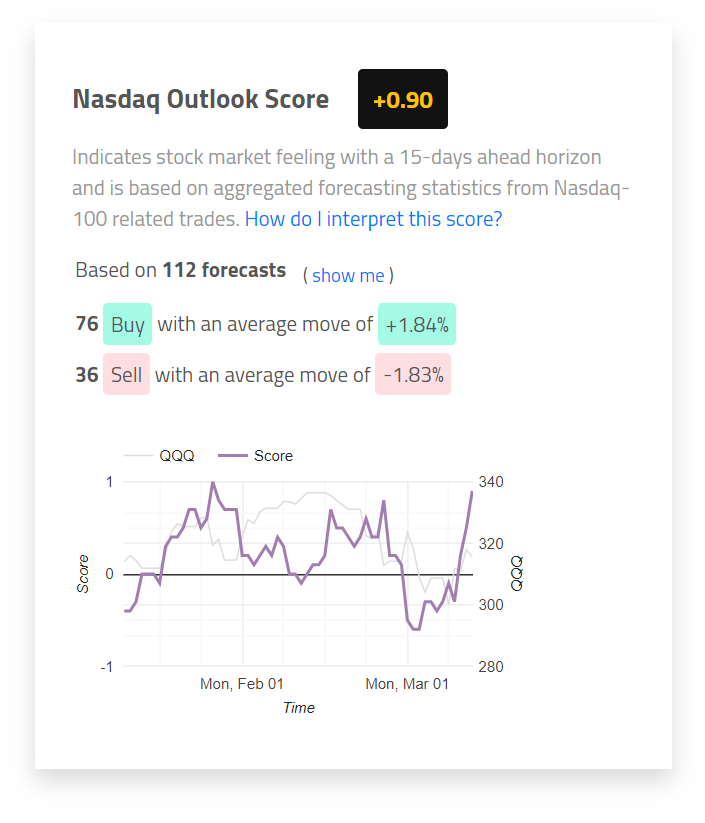
An example of Outlook Score signal. -
Nasdaq Forecasted Volatility: It is the standard deviation of the forecasted 3-weeks ahead movements. We generate an average percentage based on all our daily forecasts. A high percentage shows increased predicted volatility from our models in the next 3 weeks. We interpret high forecasted volatility as a signal to be more cautious.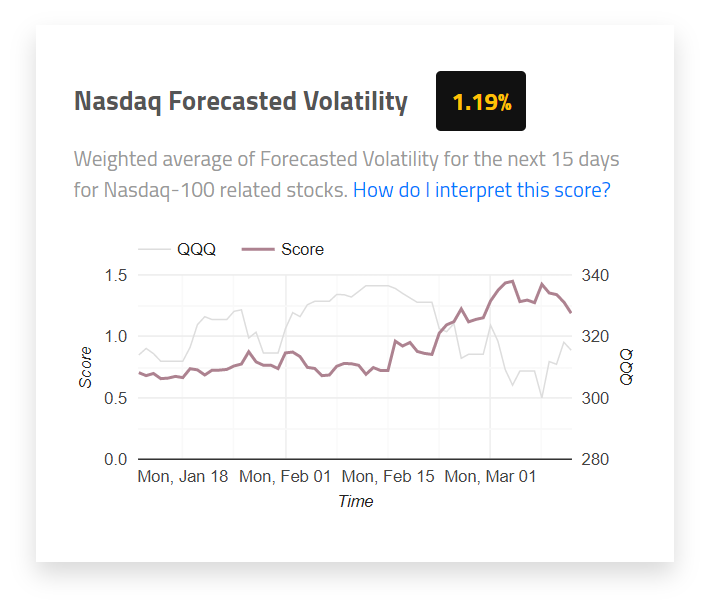
An example of Forecasted Volatility signal. -
Nasdaq Models Uncertainty: Indicates how confident our models are about their forecasts. You can inspect the uncertainty of a forecast by looking at the confidence intervals (the shadows around a forecast). The wider those shadows are, the more uncertain the model is about its forecast. To be more accurate, uncertainty of a model might mean that it hasn't seen similar data patterns in its training phase. Or it might mean that, based on past data, price has been fluctuating a lot during similar periods. In any case, low uncertainty shouldn't be interpreted as high accuracy but as a signal to be more cautious.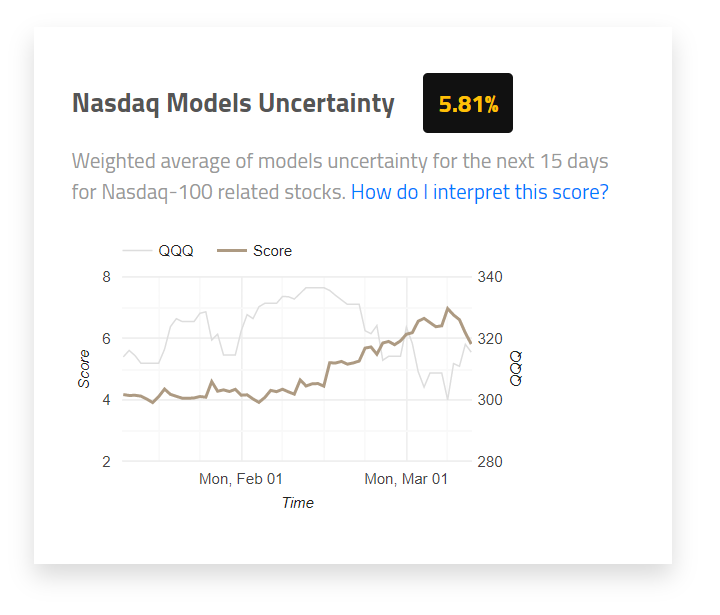
An example of Model Uncertainty signal.
All the above signals are based on Trade Picks and Forecasts generated by hundreds of Deep Learning models daily. In the next sections, we'll go through all the building blocks of our AI pipeline.
How to study a Trade Pick
Trade Picks are generated a few hours after market closes daily.
You might say that Trade Picks are the tip of the Predicto iceberg. This is pretty accurate as there is a lot going on
behind the scenes to reach this point. You will get to know more as we go on. Trade Picks are available daily
in the PredictoAI section. We use those Trade Picks and their outcomes to rank our deep
learning models with an additional metric.
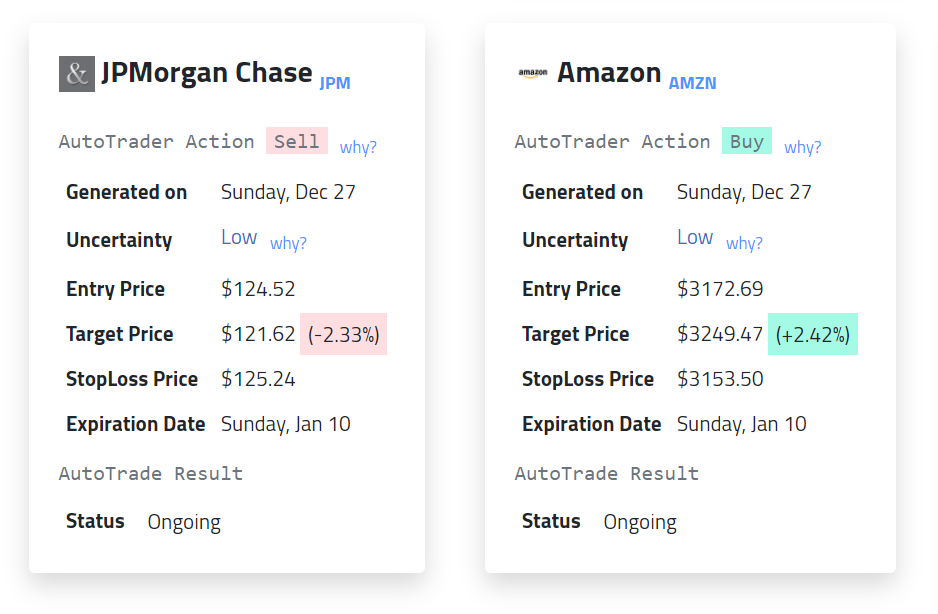
All our Trade Picks refer to a specific stock and come with an
Action: BUY (meaning the model predicts the short term price to go up) or SELL (meaning it predicts it will go down),
Entry Price: the price to enter a position (this is the last day's closing price),
Target Price: the price we expect this stock to reach,
Stop Loss Price: the price to exit a position if it goes the opposite direction (this is to hedge our positions against bad forecasts),
Expiration Date: when to exit the position if stock price failed to move outside target and stop-loss prices.
An example appears below.
Trade Picks are based on Predicto's forecasts (more on forecasts in the next section). Once a forecast is generated
every day for each stock, we go ahead and generate a Trade Pick as well. We always make sure to hedge our
Trade Picks with a stop-loss price. We also attach an Uncertainty label (Low, Medium, High) on each Trade Pick
based on the underlying forecast's confidence intervals (more details on this in the next section).
The next step is to follow the Why links attached to each Trade Pick to study the underlying forecast.
Remember that every Trade Pick is based on a forecast so it's important to understand how this forecast was
generated. And this leads us to the next section!
How to study a forecast
Our models are trained to produce 3-weeks ahead forecasts. That explains why the Expiration Date
field of every Trade Pick is 3 weeks after the Generated On date. Take a moment to check the
example Trade Picks cards given above to verify that.
For every stock we train a few models using different features and architectures. Those have some weird names
such as LSTM, CONV1D, LSTMCONV1D but don't worry too much about that.
Just keep in mind that those are different base models used to produce our final synthesized model.
The final model is named Predicto_v3_Simple. See some examples
of the latest forecasts for
Microsoft,
Apple and
Amazon to understand what they look like.
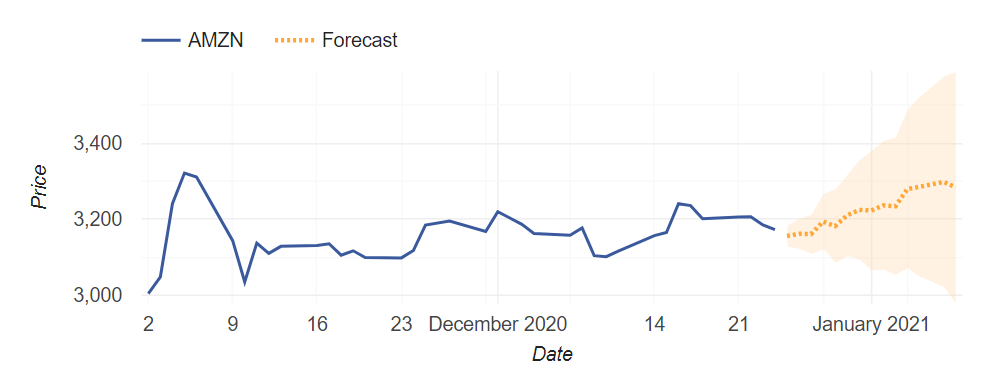
In the above example, the orange dotted line is our forecast. The shaded orange area represents the confidence intervals: to simplify, what this means is that our model believes that there is 95% probability that future price will fall within those intervals. This is just what the model believes based on training data and there is no real guarantee that this will happen. Sudden events or trending news might affect the stock price in new and unexpected ways.
Depending on how broad those confidence intervals are, we categorize our forecast's Uncertainty in 3 buckets:
Low, Medium and High. Again, those are just estimates based on training data.
This categorization is what appears in a Trade Pick's Uncertainty field.
As mentioned earlier, Predicto_v3_Simple is our final synthesized model.
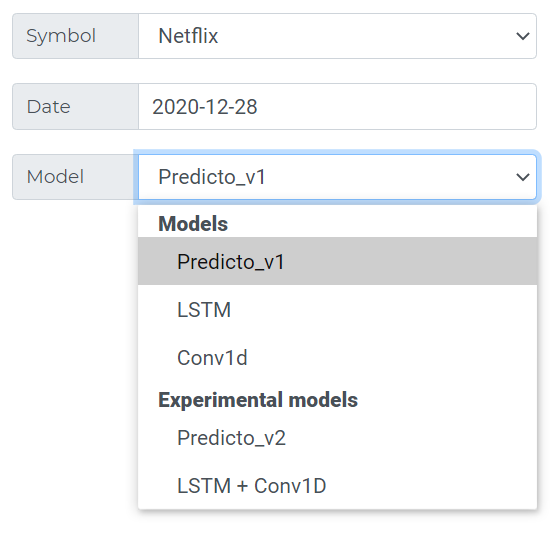
You can explore different models from the 'Model' dropdown menu in a stock's
Forecast page, including some experimental ones from time to time.
The base models offer some further insights with Explainability Heatmaps that reveal which Factors
and which Time Periods influenced their forecasts and by how much. It's also usually a good sign if those base forecasts
agree with each other on the direction of the stock price. So it's a good idea to examine those closer.
With the term Factors, we mean data categories. For example some Factors are
Volume,
Index Prices,
Options Activity,
News activity and many others. Different models might use different factors.
As an exercise, let's have a closer look at an Explainability Heatmap from
Amazon forecast
of LSTM base model on December 27th and how to read it.
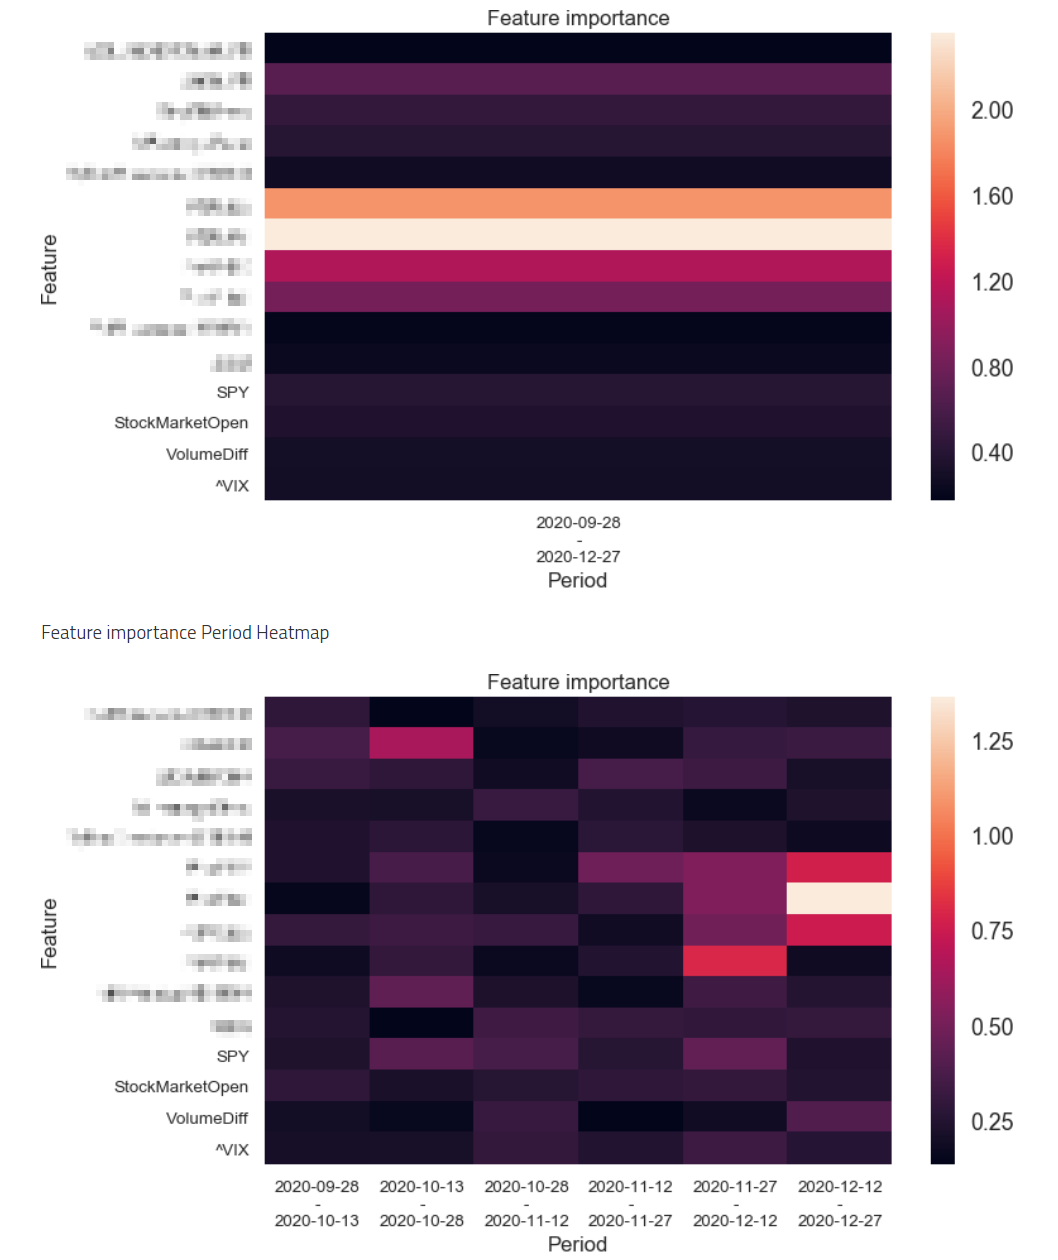
On the left side of the explainability heatmaps you can see the Factors, and on the bottom side you can see the time periods. The brighter a spot is, the more influence it had in our forecast. Whenever you can see clearly brighter sections on those heatmaps, it usually means that our models saw something in those areas. In the example above, we can identiy that this model's forecast was influenced by options data activity in the last 1 to 2 weeks. We provide a heatmap to study factors of influence as a whole, and another heatmap to study factors/time periods pairs. There are more graphs in the forecasting section that you can explore.
How to study recent Performance
Now that we know how to study a forecast and what kind of models we provide, let's have a look on how to study recent performance of each model. You might be tempted to trust a model's forecast because the Explainability Heatmaps and Factors of influence make sense to you. But it's always wise to see how a model's forecast has been performing in the recent past. Deep Learning models are able to identify complex patterns, but those patterns don't last for ever. Models might perform well for a period of time, and then underperform. It's up to the user to study when and why this happens.
For that reason, we generate Perfomance GIFs every week that demonstrate all recent forecasts of the last 30 to 45 days
against the actual stock price. We do this for every Stock/Model pair.
As an example, here is the Amazon's LSTM model Performance GIF.
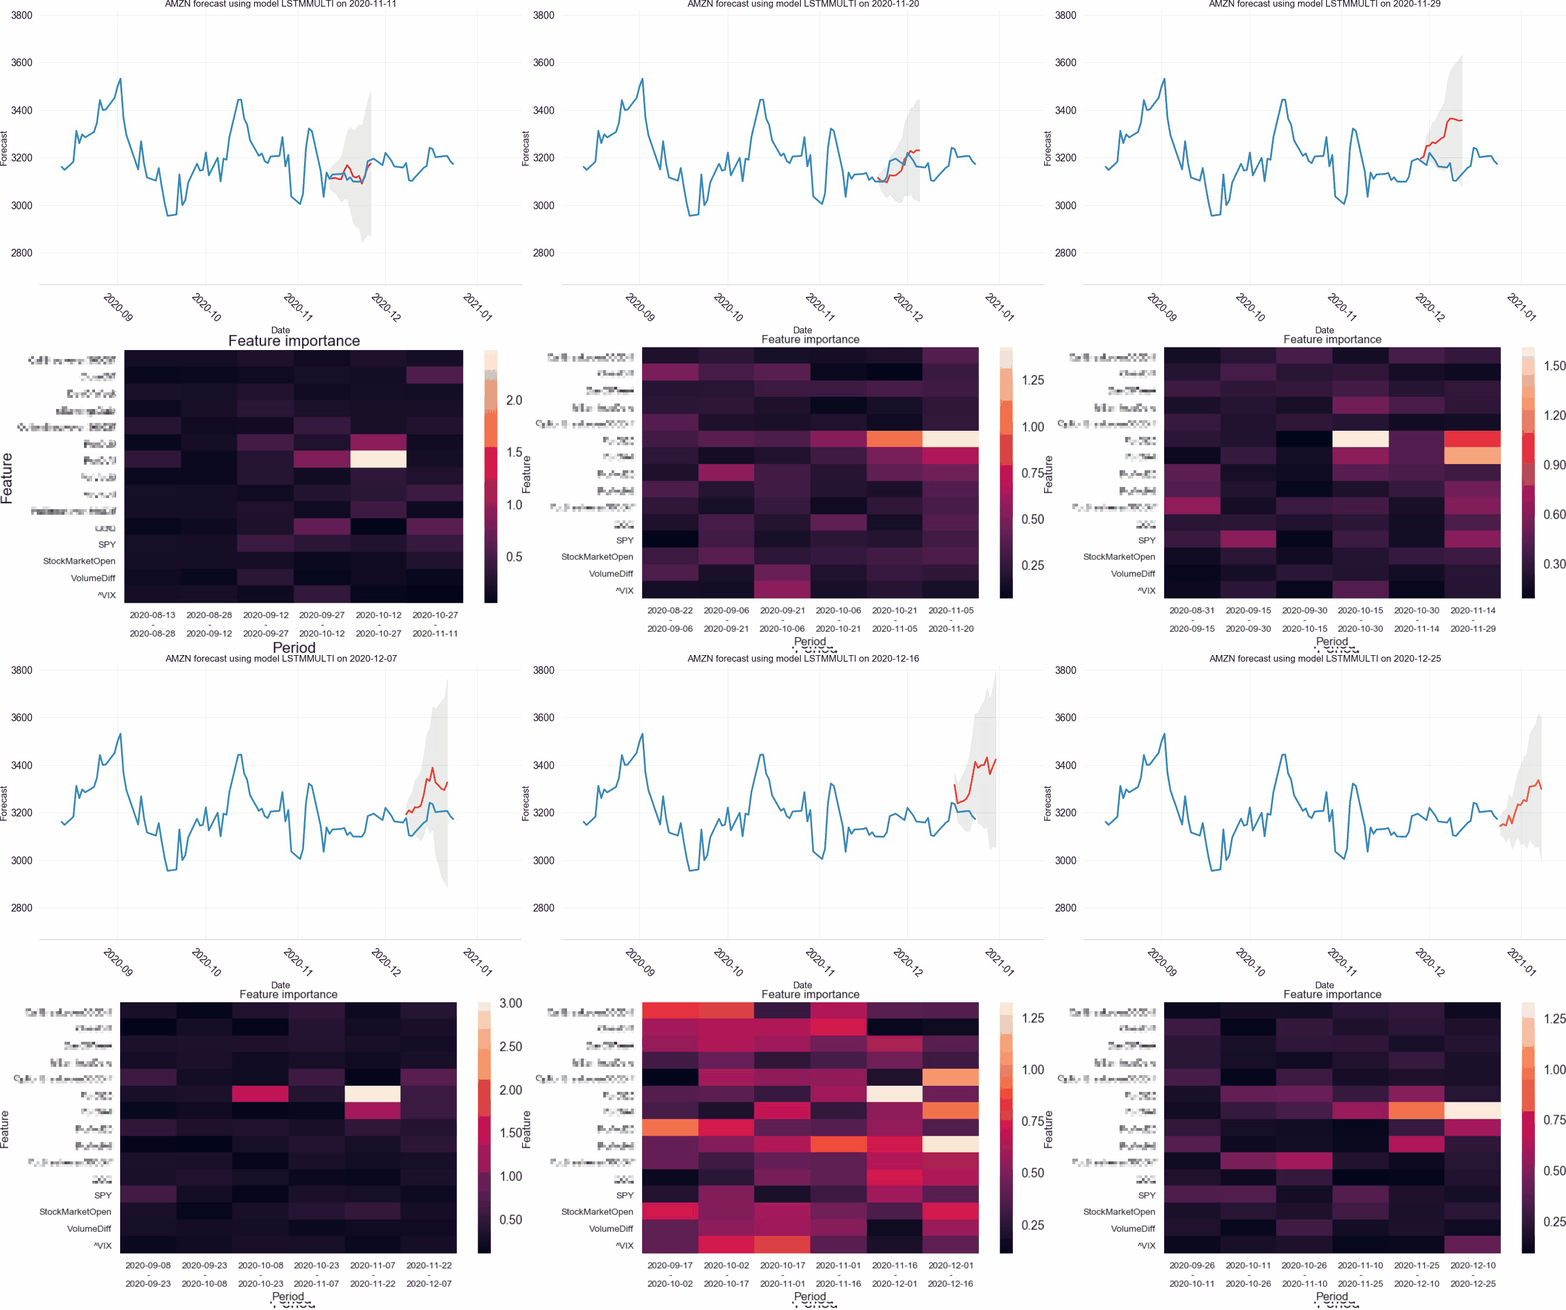
If recent forecast performance of a model seems satisfactory, then a user can decide that this is a good opportunity to trust latest forecast. This is a very important piece as you can quickly understand what a model "sees" and how it performs over time. Kind of like a movie through the eyes of a Deep Learning model!
Conclusion
And this concludes our beginner's guide to Predicto. We explored a few ways to reach conclusions and make a bit more informed decisions when it comes to short term trading.
There are more ways to use our platform, and more insights to discover. This was just the beginning.
Time to start exploring!
