Introducing Predicto Market Outlook
Currently, Predicto tracks around 150 stocks, including the entire Nasdaq-100 list. For every single one of those stocks we maintain at least 3 different Deep Learning models, sometimes more based on our experimentation. This means we maintain and occasionally retrain more than 450 models. On top of this, a forecast with an explanation is generated daily for each stock/model pair.
Experimenting with the combined forecasting power of all our models can be a lot of fun.
What are Market Outlook Scores
By combining forecasts and trades generated by our
PredictoAI
from all models related to Nasdaq-100 list,
we are able to compile a forecast score. This can be applied to any group of stocks, or even
portfolios. We call those scores Outlook Scores
and they indicate the stock market feeling with a 3-weeks ahead horizon.
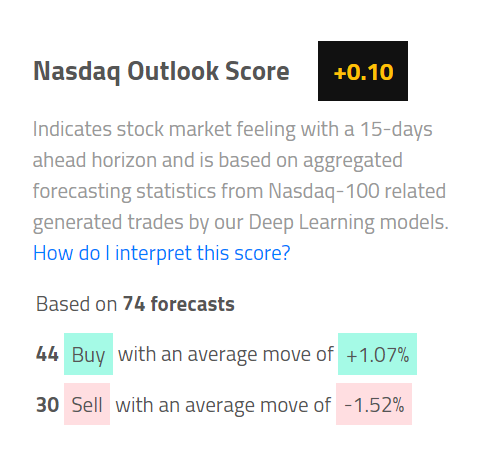
Predicto uses all Nasdaq-100 stocks forecasts to derive Nasdaq-100 Outlook Score.
Similarly FAANGM Outlook Score is derived from
Facebook, Apple, Amazon, Netflix, Google and Microsoft forecasts.
Crypto Outlook Score is derived from our list of tracked cryptocurrencies.
As we track more and more stocks, the list of Outlook Scores will grow.
In general, a positive score predicts that prices will go up, and a negative score that prices will go down at some point in the next 3 weeks.
Always keep in mind that those models and scores are experimental.
Please read our disclaimer carefully.
How to use them
We designed a dedicated
Outlook
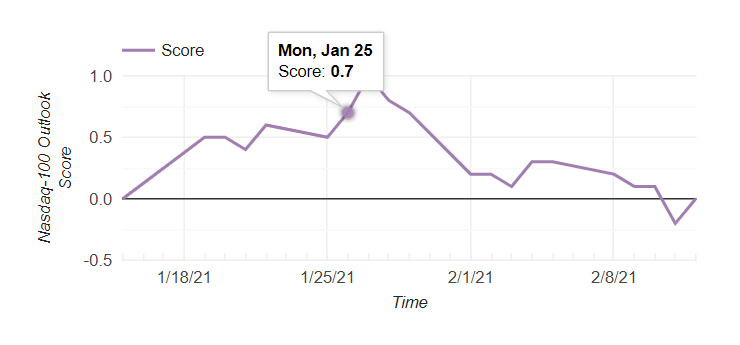
section where you can inspect the latest Outlook Scores and explore how they change over time.
Below you can see an example for Nasdaq-100 Outlook Score


How are they calculated?
To generate these scores, we calculate the weighted average of 3-weeks forecasted returns from a group of stocks. The weight of each stock is based on its market cap and revenue.
To simplify, if we had 3 stocks (s1, s2, s3) with weights (w1, w2, w3) then the final score would be:
Outlook Score = (s1_forecasted_return * w1) + (s2_forecasted_return * w2) + (s3_forecasted_return * w3)
Here is an example:
Stock1 Forecasted 3-weeks return = 1.5%, Weight = 0.4
Stock2 Forecasted 3-weeks return = 0.5%, Weight = 0.4
Stock3 Forecasted 3-weeks return = 9.0%, Weight = 0.2
So in the above case we'll get
Outlook Score = (0.015 x 0.4) + (0.005 x 0.4) + (0.09 x 0.2) = + 2.6 %
What's next?
We are planning to scale and support more stocks and ETFs in the future covering the entire stock market spectrum. As we grow, we'll be able to generate more and more usefull insights.
Stay tuned, Stay safe!
